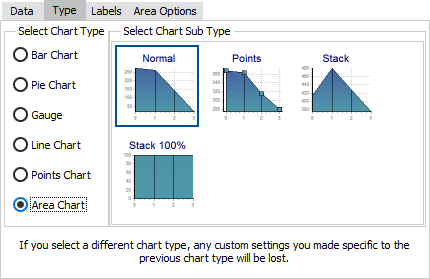
Chart Wizard - Area Chart Properties
Area charts are not as commonly used as some other chart types, but can be useful in showing how some data develops over time. This chart type is most effective when there is a considerable difference between your values.
After you have selected an area chart from the list of chart types on the Type tab, you can then select a chart sub-type and configure various chart options.
Area Chart Sub-Types
The chart sub-type determines how the area for the selected series will appear.

![]()
Standard charts have two options for the sub-type:
- Stack - When more than one series is present, the second series will display on top of the first.
- Stack 100% - Display the values as percentages. When more than one series is present, each data point will show the percentage that each series contributes to the total, summing to 100%.
Classic charts have two additional options:
- Normal - Display the series on top of one another. This may obscure data from the series in the back.
- Points - The same as Normal, except each data point has a visible point.
Area Chart Options
The Area Options tab provides some additional configuration options for area charts:

- Horizontal - Classic charts only. Checking this box switches the axis so that the area is displayed horizontally instead of vertically.
- Color - Choose a color for the area under the selected series.
See also: Configuring Series Labels